Overall Analysis
Bitcoin moves upwards in the 3rd Nov trading session, facing rejection from a higher level and indicating sideways momentum.
Ethereum, on the 3rd Nov trading session, synced with Bitcoin and is currently moving near major support levels.
Bitcoin Chart Analysis
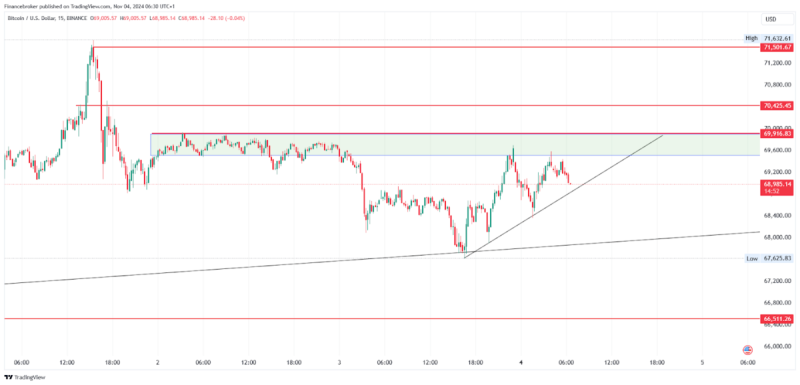
BTC/USD 15-Minute Chart (Source: TradingView)
In the trading session on October 3, 2024, Bitcoin showed an upside rally in a 15-minute time frame, eventually facing rejection at the $69,600 level.
Currently looking at trends on higher time frames (daily time), Bitcoin is in a bull run, and the price is taking a pause on a higher level, hence creating swings.
Looking at Bitcoin in a 15 min time frame, we can see price is currently moving in a tight zone, creating a sideways moment. The price has faced strong rejection multiple times, between $69,500 and $69,916.
If talking about the trade opportunities, then scalping trade can be captured in the current market with strict stop loss. Here are a few entry triggers.
If the price takes support from the swing trendline, then entry can be made based on a strong buying candle with a stop loss below the recent swing and a target of $69,500 and $69,900 based on trailing stop loss.
If the price breaks the trend line and settles below it, then plan to sell-side entry once the price breaks the $68,667 level with a stop loss above the recent swing high and target to $67,887.
Please note that Bitcoin is currently in the sideways zone; one must use a stick-trailing method.
Ethereum Chart Analysis
ETH/USD 15-Minute Chart (Source: TradingView)
During the trading session on October 3, 2024, Ethereum moved upside down and faced rejection at the $2,490 level. Price moment can be clearly seen syncing with Bitcoin; hence, both the major cryptos are in a sideways zone.
Looking at Ethereum on a daily time frame, we can clearly see that the price has been in the channel for a very long time; hence there are low moments in the price.
If planning for an entry make sure the price is moving in a strict area impacting risk to reward ratio. Talking about entry triggers, there are a few mentioned below.
If the price takes support from the recent trend line, then entry can be made for the target of $2,490 and stop loss below the previous swing low. Make sure to trail the target, as a price break above the $2,496 level and a successful settlement could lead to higher levels.
If the price breaks the supporting trendline and settles below it, then wait for it to break the $2,450 level, then make an entry for the targets of $2,420 with a stop loss above the previous swing high.
The post Bitcoin and Ethereum Analysis: Price Movement & Key Levels appeared first on FinanceBrokerage.
Unearthed footage of Barron Trump speaking with mom’s accent spreads like wildfire after dad’s massive win
Videos of future first son Barron Trump speaking in a Slovenian accent as a young boy are …


